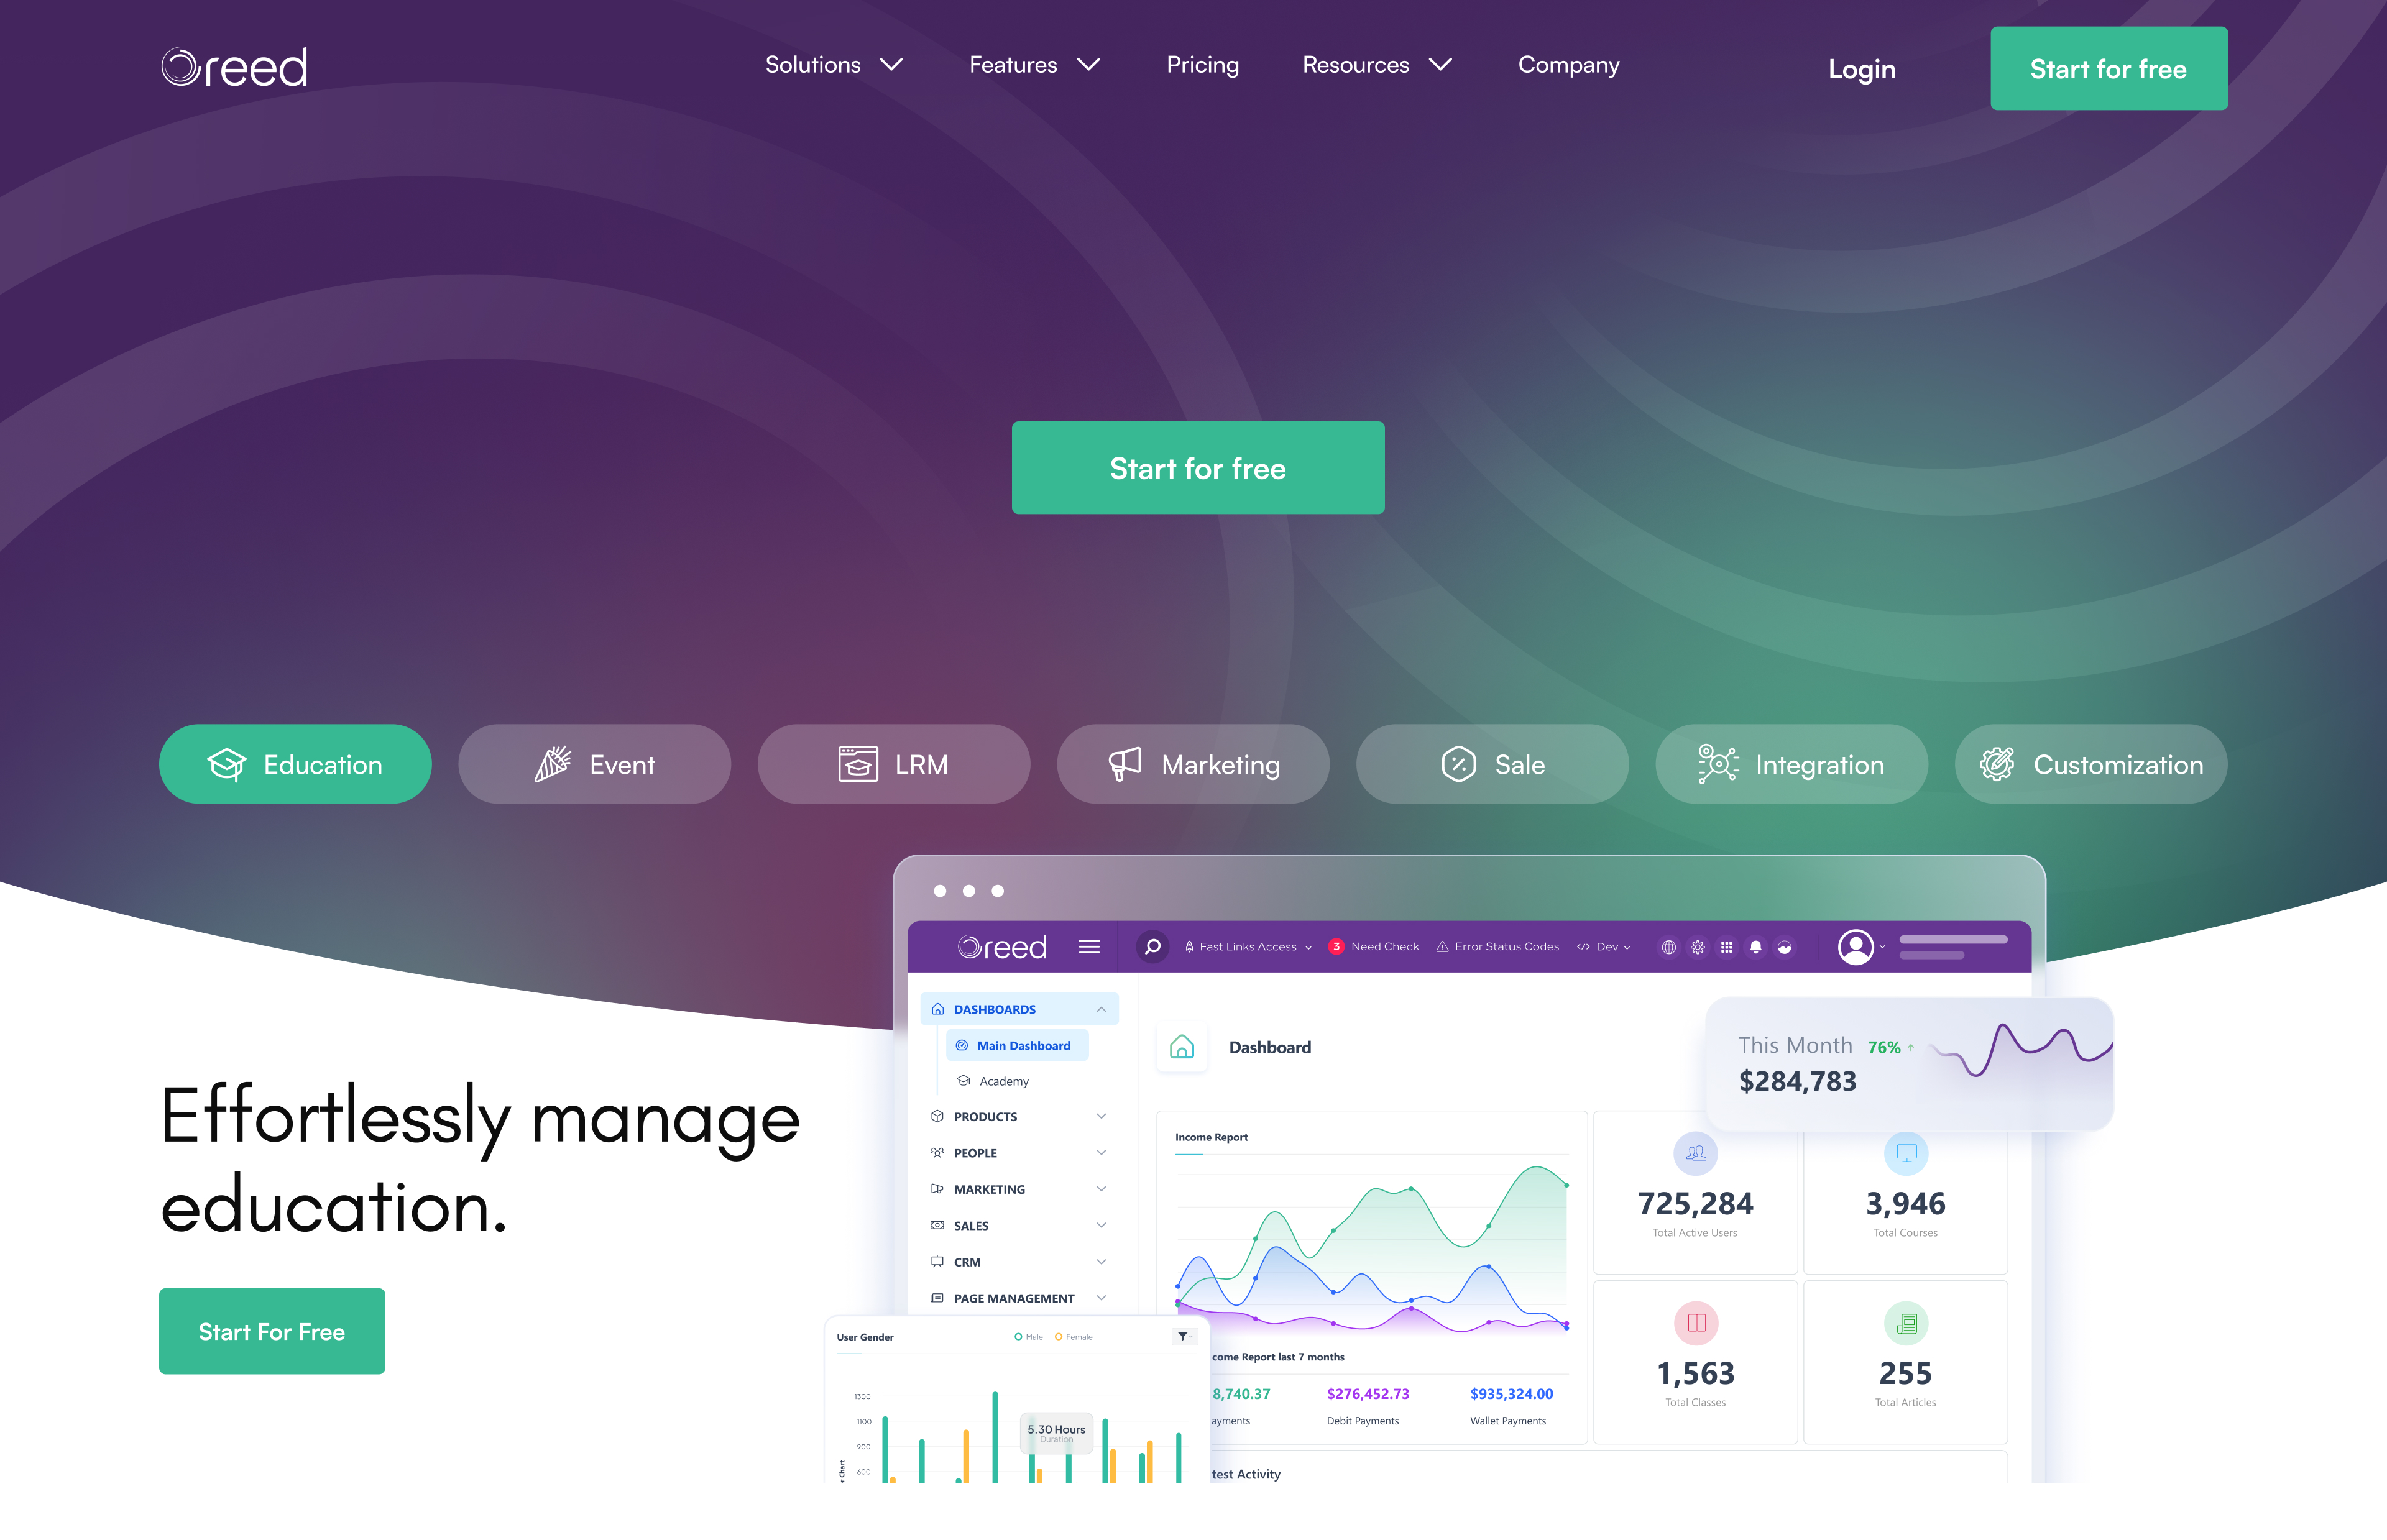
About The Project
As you gear to position itself as a leader in t he E-Commerce industry, relent less execution, and data-driven decision-making become imperative to your success. Ascend Analytics aims to help you in driving its growt h by leveraging t he power of data and analytics. The following dashboards broadly define t he scope and objectives of t he initiative :

Customer And Traffic Analysis
The following dashboard gives visibility on aspects of customer retention and cohorting analytics. It does this by showing :
- New sign-ups by month
- Repeat users versus new users
- Percentage retention of users by month
- Frequency in the number of orders by area
- Holistic metrics such as totals
The next few charts provide visibility on customer metric as well as customer traffic information. These include :
- The retention rate of customers using a retention matrix
- The MoM Customer Lifetime Values, along with percentage changes between the months
- A view on both through which channel the most traffic is coming from as well as how much, in the form of pie and stacked column chart

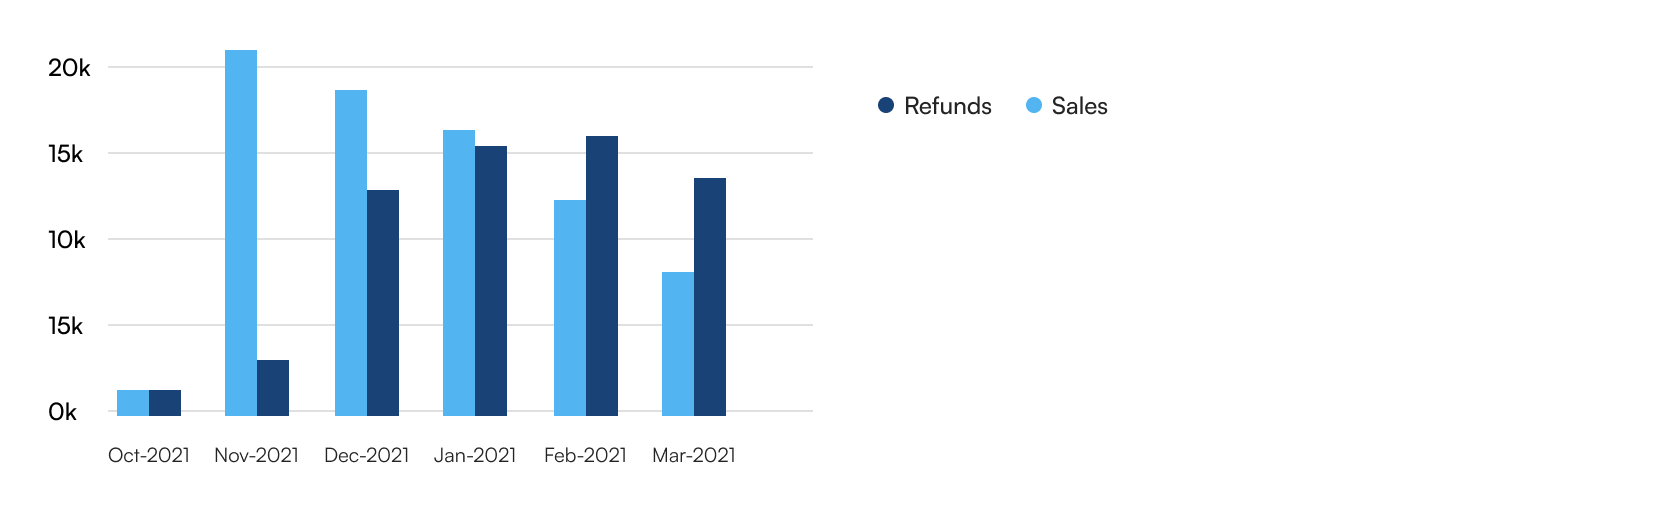
Growth Analysis
The growth analytics dashboard enables you to keep a check on and evaluate the growth performance of your company and its ability to grow smoothly and sustainably over time. The charts from the dashboard below show
- The MoM change in sales and it’s comparison with refunds
- A line chart for the total sales trend over time
- A cumulative journey to X number of products sold, along with the number of days taken for a number of products sold as well
The next few charts provide visibility on customer metric as well as customer traffic information. These include
- The retention rate of customers using a retention matrix.
A line chart showing the sales forecast for the coming time period, represented by a dotted line
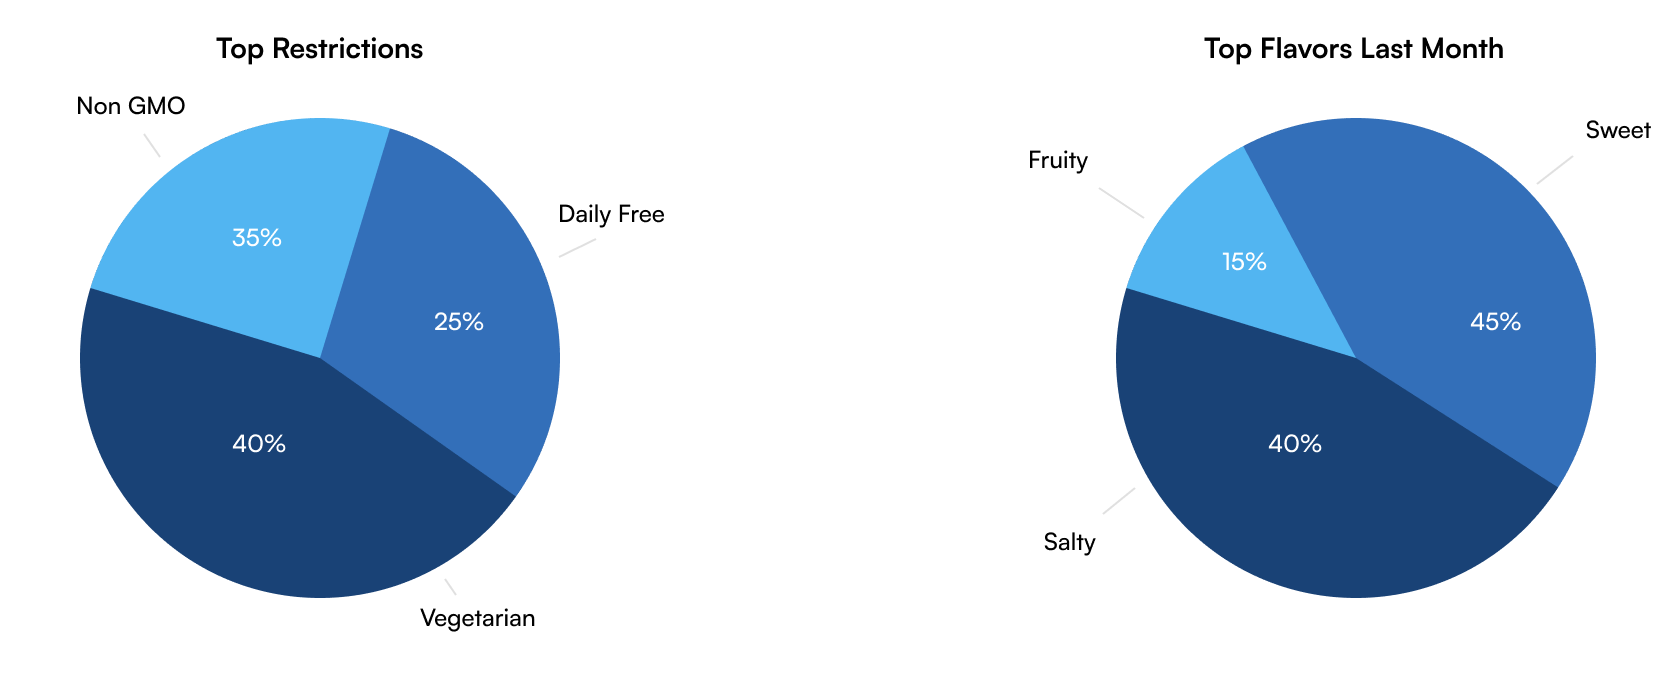
Performance Analysis
The charts below are examples from a dashboard with per formance metrics. These metrics provide visibility on :
- The number of orders and sales over a cer tain period of time.
- Top performers within a certain category, which can be applied to any kind of product.
- A daily trend on how orders and sales have been performing
The expected sales as well as the actual sales in order to see how far off the sales taken place were from expectations, along with the profit.
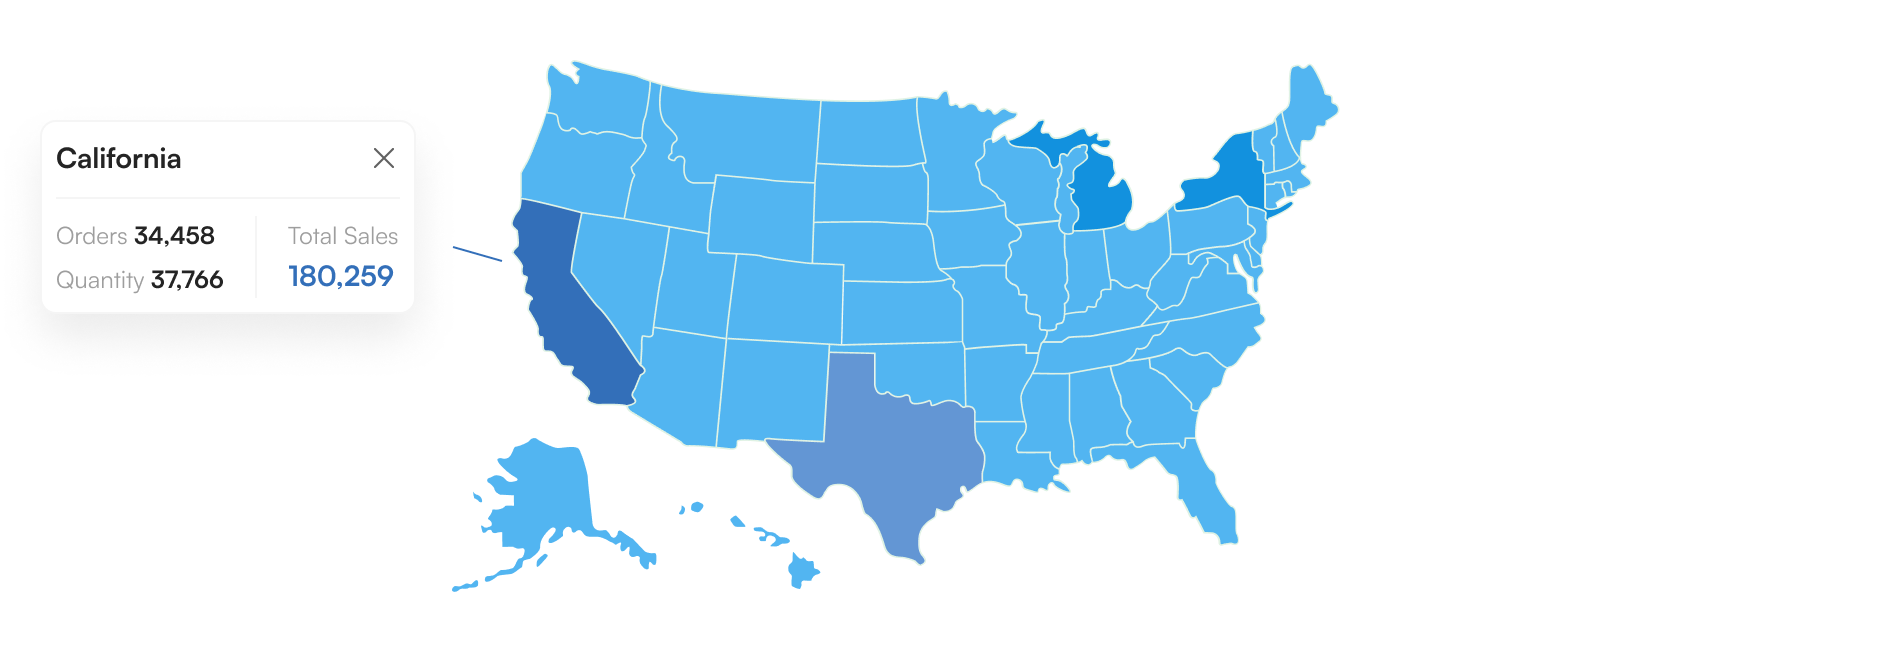
Geospatial Analysis
The geospatial analysis enables users to sort and filter people according to various areas, categories, and dimensions. The dashboard below shows:
- A heatmap with the color shade determined by the number of orders
- A separate city and/or state level analysis on a tabular level